Location-Character Force Directed
About These Graphs
|
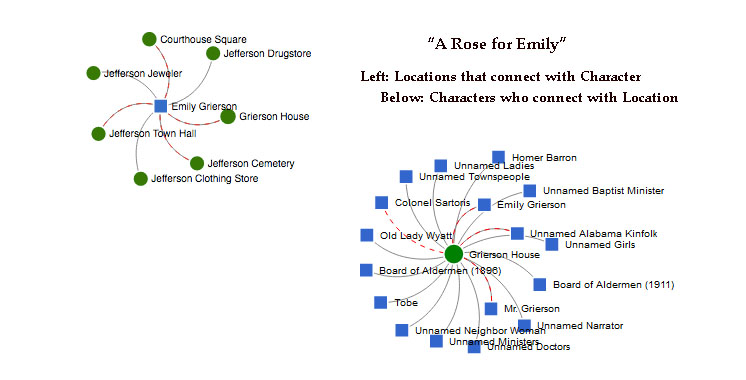
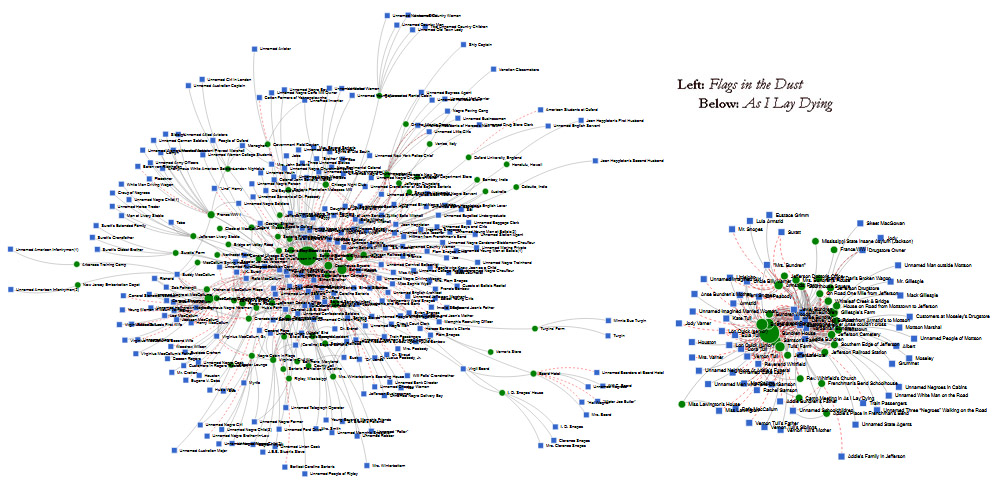
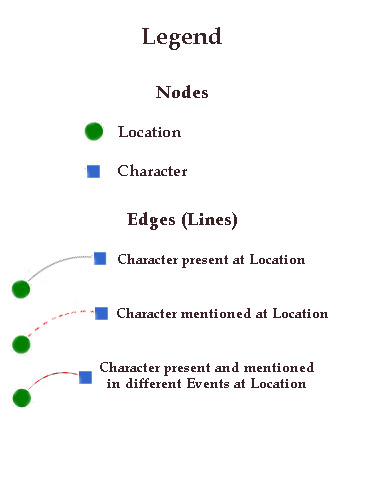
The visualizations you can create here display the relationships between Characters and Locations in a text as a "force directed" graph. Force directed graphs are networks of "nodes" and linking "edges" (lines) plotted using an algorithm that models a graph in analogy to a physical system with forces of attraction and repulsion exerted between nodes. Here the nodes are the text's Characters (represented by blue squares) and the Locations of the Events in which they appear (green circles). For Locations, the size of the circle indicates the relative prominence of the Location in the narrative, as measured by the number of Events that take place there. The forces behind a force directed display can be likened to the interactions of a group of bar magnets, where each positive pole pushes away the other magnets' positive poles but is attracted to their negative poles. The charge carried by each node (i.e. each Location and Character) repels all the other nodes, out to the circumference of the graph, but every instance of connection between any two of them pulls them both together toward the middle; the more connections, the closer they get. The graphs are created by a logic of co-occurrence: if a Character appears in an Event, then that Character is said to be connected to the Location in which the Event takes place. The resulting graph is a bipartite graph, meaning that it contains two types of node (Characters and Locations), and the edges only connect a node of one type to a node of the other type. On the graphs you can create here, Characters are directly connected to Locations only, and vice versa, never to each other. Instead, Characters are related to each other transitively, by sharing a connection to a Location.  The relationships are shown in composite or synchronic form, meaning that if two Characters are connected to the same Location in the graph, it does not follow that the two Characters must have appeared in the same Event in the novel. This is something like what an archaeologist finds in a settlement pattern: she sees the tracks of generations of people and animals, all superimposed onto a village plan, which shows the inhabitants' recurring pathways of movement. A graph will exhibit a number of quantitative properties that may be relevant to the interpretation of the story. For example, one may calculate which Characters or Locations are most "central" as well as those that are most "between" the other nodes - but note, "central" is a positional concept here: closer to the center of the array, not necessarily most central to the meaning of the narrative. Many of these properties may be grasped qualitatively as well. For example, each graph may be characterized by nodes that are central, peripheral, and liminal. You may sometimes discern oppositions between Characters and between Locations. Some stories may be Character-centric and others Location-centric. For example, below are the basic graphs for two of Faulkner's earliest Yoknapatawpha novels, where you can see how important the Sartoris plantation (the large green circle at the center, below left) is to Flags in the Dust, and on the other hand how important the the members of the Bundren family (the six blue squares at the center, below right) are to As I Lay Dying:  Other things are immediately apparent from these two graphs. One is the sprawling nature of Flags as opposed to the more tightly-wound nature of As I Lay Dying. Another, however, is that in many instances graphs may be too crowded to be interpretively useful, or even legible. You can control the amount of information displayed and isolate selected aspects of a text in several ways, including by using the filters at the top of the page. For more on these options, and examples about how these graphs might be useful to explore narrative and interpretive patterns within texts, please watch the 6-minute video. In pursuing these explorations, it is important to understand that the force-directed algorithm is nondeterministic in how the nodes and edges are positioned. This means that each time the visualization is generated, the positioning of the nodes (top or bottom, left or right) can be different from a previous instance, even though the graph itself is the same. However, the most interpretively significant features remain evident throughout the various iterations a visualization may undergo. These features include a node's size, the number of edges it has, and its relative placement within the graph when compared to other nodes. There is one other point that needs to be made. All of the visual re-conceptualizations provided in Digital Yoknapatawpha are very partial re-presentations of Faulkner's fiction. The different visualizations can call attention to different aspects of the texts, with the potential to provide new digital pathways to help you reach your own interpretive conclusions, but all should be understood as provocative rather than definitive. Citing this page: |

- Log in to post comments
